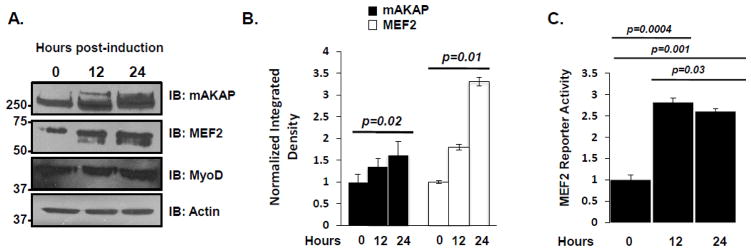
Figure 1. mAKAP and MEF2 expression show a parallel increase during myogenic differentiation.
(A) C2C12 myoblasts were washed with PBS extensively before the addition of differentiation media. Cell lysate was collected at the time points indicated and proteins were analyzed by immunoblot. n=3. (B) Quantification of the western blots shown in A, normalizing the actin. n=3. (C) C2C12 myoblasts were infected with an adenoviral MEF2 luciferase reporter and β-galactosidase. The resulting transcriptional activity was read at the times indicated. Normalized luciferase values were obtained by dividing the luciferase value by the β-galactosidase control value. n=3. Data shown are mean SEM from three representative experiments.

