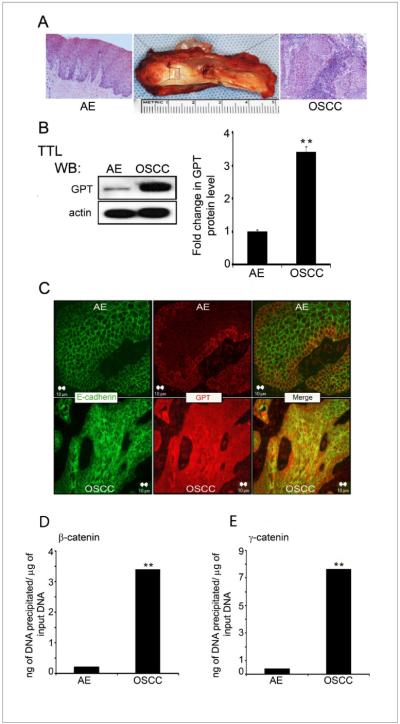
Figure 1. Overexpression of DPAGT1 in OSCC is associated with increased promoter occupancy of β- and γ-catenins.
(A) Composite resection specimen of OSCC and AE. (B) Western blot of GPT expression in AE and OSCC total tissue lysates (TTLs). Bargraph, Fold change in GPT levels after normalization to actin. (*p<0.05).(C) Immunofluorescence localization of E-cadherin and GPT in AE and OSCC. Size bar: 10 μm. (D) ChIP analysis of β-catenin at the DPAGT1 promoter in AE and OSCC(**p< 0.01). (E) ChIP analysis of γ-catenin at the DPAGT1 promoter in AE and OSCC (**p< 0.01). All results are from three independent experiments.

