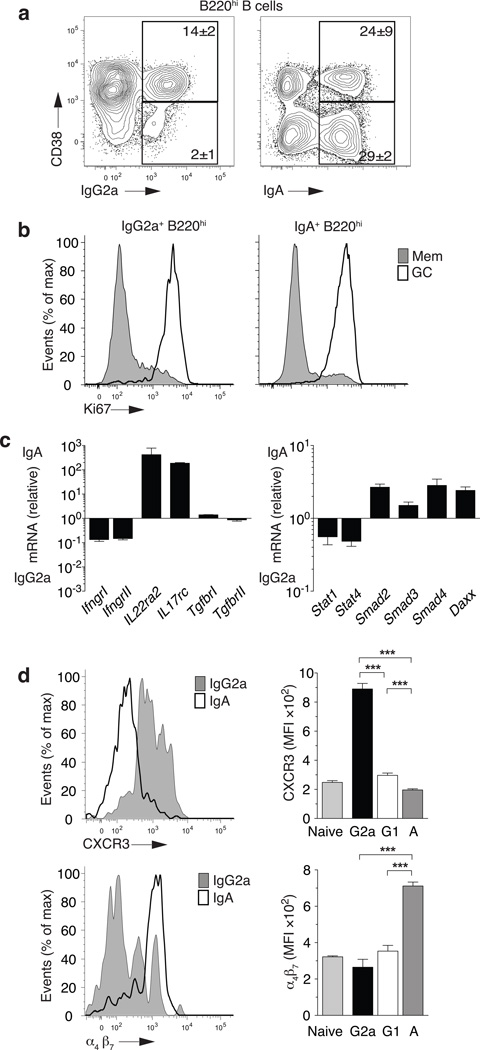
Figure 6. Separable programs for IgG2a+ and IgA+ memory B cells.
(a) Frequency of Gr1−CD4−CD8−, B cell positive [CD19+orCD138+], switched IgM−IgD−, class-specific CD138−B220hi B cells in unimmunized C57BL/6 mice. Representative staining from spleen (left panel) and Peyers Patches (right panel) (b) Ki67 staining on cells from (a). Shaded histograms are from CD38+ (memory) cells gated as in (a), and white histograms are CD38− (GC) cells gated as in (a). (c) mRNA expression of IgG2a+ or IgA+ splenic B cells (a) for cytokine receptors (left panel) or signal transduction molecules (right panel). (d) Surface staining (MFI) of IgG2a+, IgG1+, IgA+ or naive splenic B cells for CXCR3 (left panels) and α4β7 (right panel). (a–d) Mean±sem; n≥4 mice. ***P<0.001.

