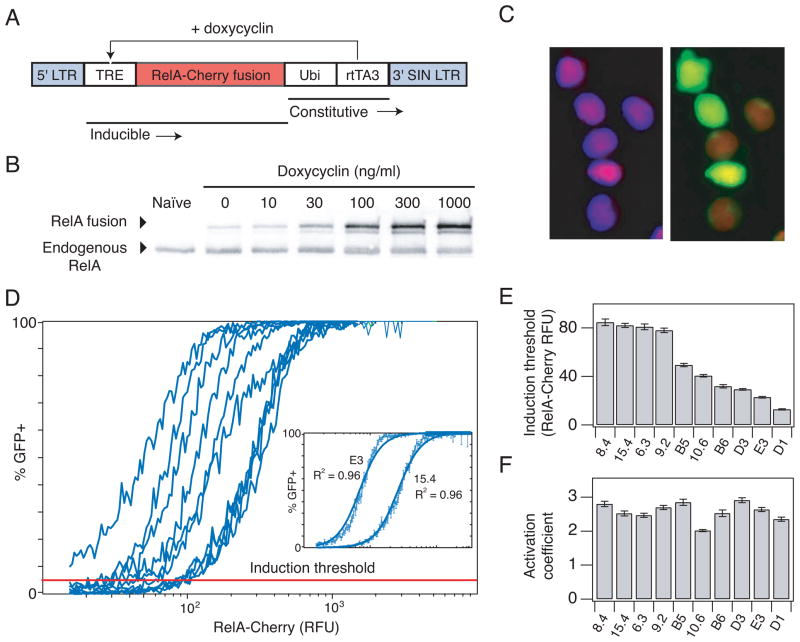
Fig. 2.
Inducing HIV gene expression by overexpression of RelA reveals an induction threshold of gene activation. (A) Schematic of the inducible RelA (iRelA) vector. (B) Immunoblot of total RelA-Cherry fusion protein and endogenous protein levels in clone 6.3 infected with iRelA 4 days after DOX induction. (C) Microscopy picture of clone 6.3 infected with iRelA 4 days after induction with 30 ng/ml DOX. (Left) DAPI and mCherry overlay. (Right) GFP and mCherry overlay. (D) Combined flow cytometry data for HIV-infected clones expressing iRelA in response to a range of DOX concentrations. More than 50,000 single cell events were divided into 256 bins of mCherry fluorescence, and the fraction of GFP+ cells was calculated and plotted for each bin. (Inset) Least squares fit line for clone 15.4 and E3. (E) Induction threshold (defined as the mCherry- RelA level at which 5% of the population expressed GFP) and (F) activation coefficient (defined as the Hill coefficient calculated from fitting Hill functions to the curves in (D)) for each clone. Error bars in (D–F) represent standard deviations and were calculated by bootstrapping.

