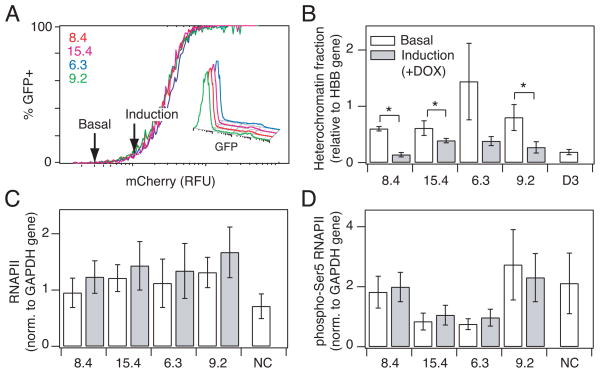
Fig. 4.
Induction of gene expression is associated with a decrease in heterochromatin fraction. (A) Selected clones were treated with 20 ng/ml DOX to hold the clonal populations at the point at which gene expression in the population is just induced (arrow). (Inset) Flow histograms showing a low fraction of cells expressing GFP for each clone at the point of induction. (B) Heterochromatin fraction as quantified by nuclease sensitivity for clones at basal (white) and induction (gray) level of RelA. Quantitative PCR was performed in triplicate and normalized to a HBB reference gene. (C–D) Chromatin immunoprecipitation comparing (C) RNA polymerase II and (D) phospho- Ser5 RNAPII bound to the LTR promoter at basal (white) and induction (gray) level of RelA. Quantitative PCR was performed in triplicate and normalized to a GAPDH control gene. Data are presented as the mean ± standard deviation. Changes are labeled as significant (*) if p < 0.05.

