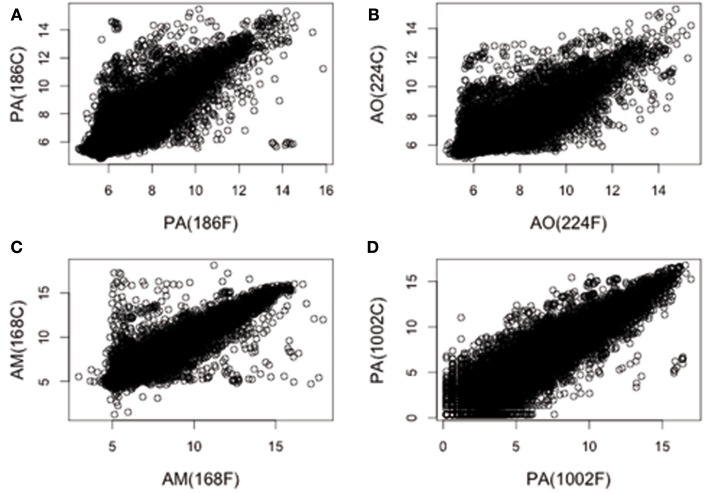
Figure 1.
Comparison of GEPs between fresh tissue samples and their derived primary cultures. The log 2 normalized values for each gene of fresh tissue pediatric brain tumors versus its primary culture are matched. In (A–D) are represented PA (sample 186), AO (sample 224), AM (sample 168), and PA (sample 1002) samples, respectively. The degree of similarity of each sample respect to its primary culture has been quantitatively explored by calculating the associated correlation coefficients. Average Pearson’s correlation coefficients were: (A), 0.88; (B), 0.86; (C), 0.94, and (D), 0.90.

