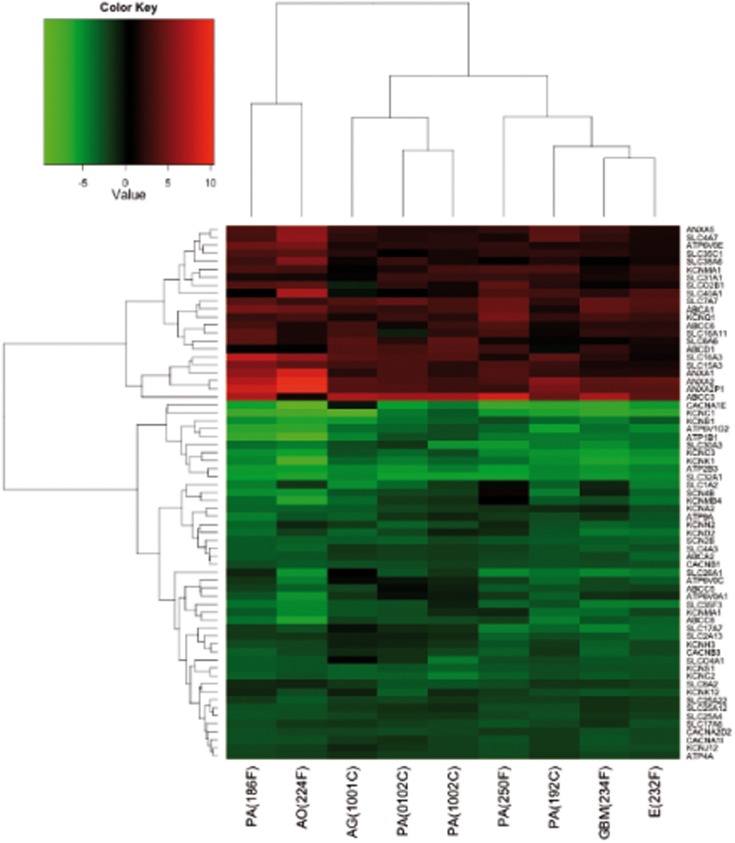
Figure 3.
Heatmap of DE genes associated to transporters and ion channels, performed, and plotted using “heatmap.2” function in R. Samples and genes (columns and rows respectively) are reordered on the basis of the average value of gene expression (log 2 ratio), and give rise to groups of genes and samples with similar average expression levels, according to the color key on the top.

