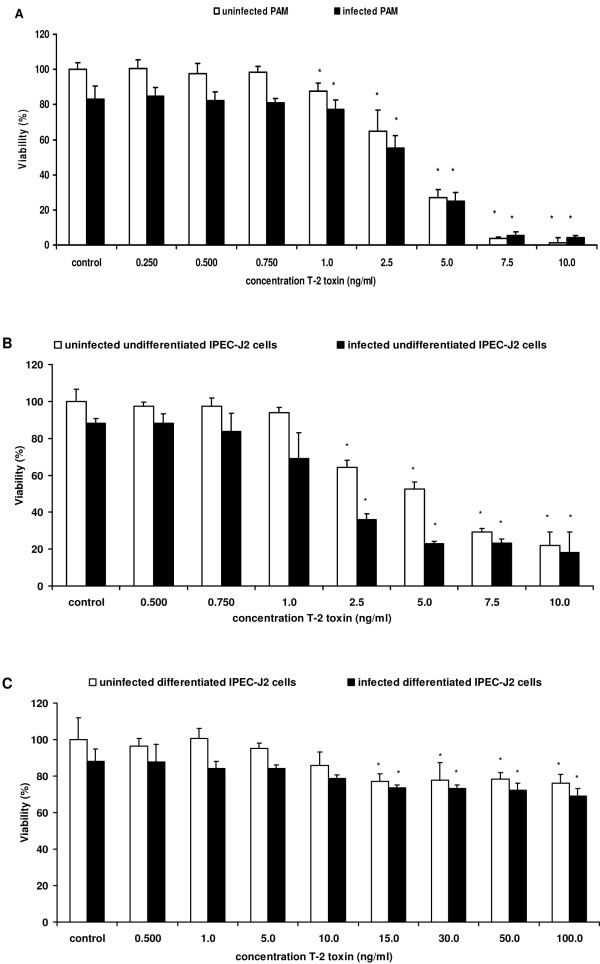
Figure 3.
The effect of T-2 toxin on the cell viability. Percentage viability (%) of Salmonella Typhimurium infected and uninfected (A) PAM exposed to different concentrations of T-2 toxin (0.250-10 ng/mL), (B) undifferentiated IPEC-J2 cells exposed to different concentrations of T-2 toxin (0.500-10 ng/mL), (C) differentiated IPEC-J2 cells exposed to different concentrations of T-2 toxin (0.500-100 ng/mL). Twenty-four hours after incubation with T-2 toxin, the cytotoxic effect was determined by neutral red assay. Results represent the means of 3 independent experiments conducted in triplicate and their standard deviation. Superscript (*) refers to a significant difference compared to the control group (p < 0.05).

