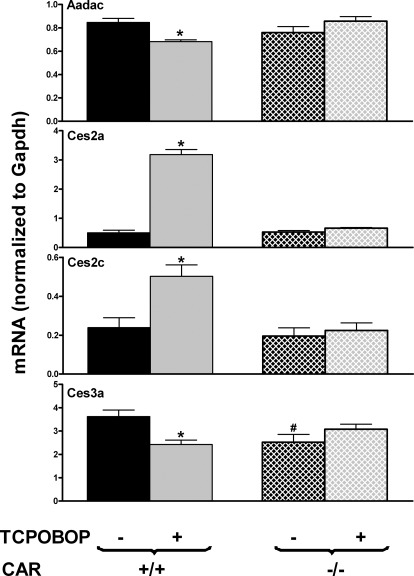
Fig. 4.
Effects of TCPOBOP on mRNA expression of Aadac, Ces2a, Ces2c, and Ces3a in livers of WT and CAR-null mice. Total RNA from livers of control and TCPOBOP-treated, male, C57BL/6 and CAR-null mice (n = 5 per group) was analyzed with the QuantiGene Plex assay. Data are reported as the carboxylesterase mRNA/GAPDH mRNA expression ratio in 500 ng of total RNA. All data are expressed as mean ± S.E. *, statistically significant differences between control and treated mice of the same genotype (p < 0.05); #, statistically significant differences between control WT and control null mice (p < 0.05).

