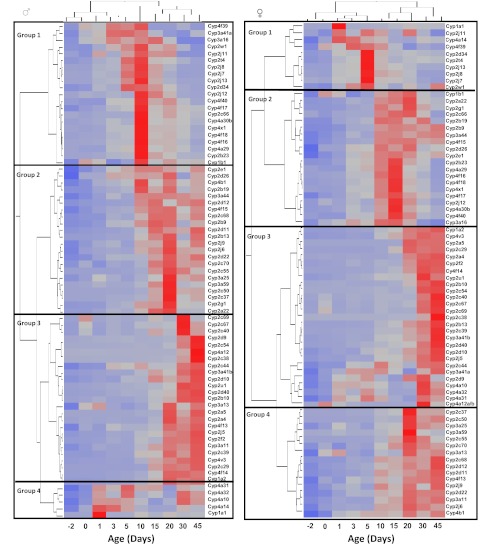
Fig. 6.
Two-way hierarchical clustering of expression profiles for Cyp1 to Cyp4 genes in livers of male (left) and female (right) mice (Ward's minimal variance; JMP 8.0). Trees describe the relationships between different gene expression profiles (left trees) and different ages (top trees). Distances between genes reflect the significance of associations. Shaded squares, average expression data for five animals per gender at each age. Red, relatively high expression; blue, relatively low expression.

