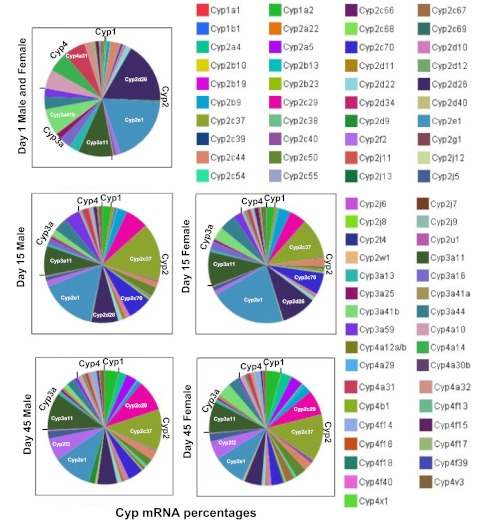
Fig. 7.
Relative proportions of P450 mRNAs at selected ages (days 1, 15, and 45, which represent neonatal, adolescent, and adult ages, respectively). Genders were not separated for day 1. The P450 mRNA levels were normalized to Gapdh mRNA levels, and the normalized mean values were used for calculation of the proportions at each age. The images were generated with JMP 8.0. The five P450s with the highest expression levels at each age are labeled.

