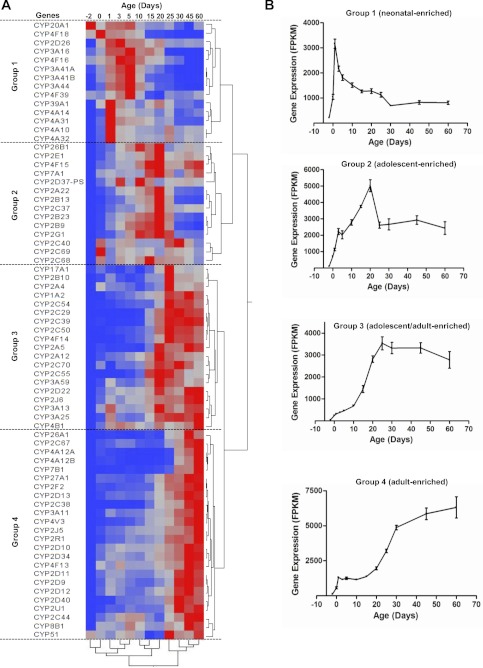
Fig. 2.
A, hierarchical clustering of expression profiles for 71 significantly expressed P450 mRNAs in livers of male C57BL/6 mice. Significant expression was determined by the FDR-BH with a threshold of <0.05. The two trees describe the relationship between different gene expression profiles (right tree) and various ages (bottom tree). The dendrogram scale represents the correlation distances. Average FPKM values of three replicates per age are given by colored squares: red, relatively high expression; blue, relatively low expression. The dashed lines categorize the expression profiles into four groups. B, changes in total FPKM values of the P450 mRNAs in each group on the basis of the hierarchical clustering in A through different ages during development. Bars represent the mean ± S.E.M. of three individual samples.

