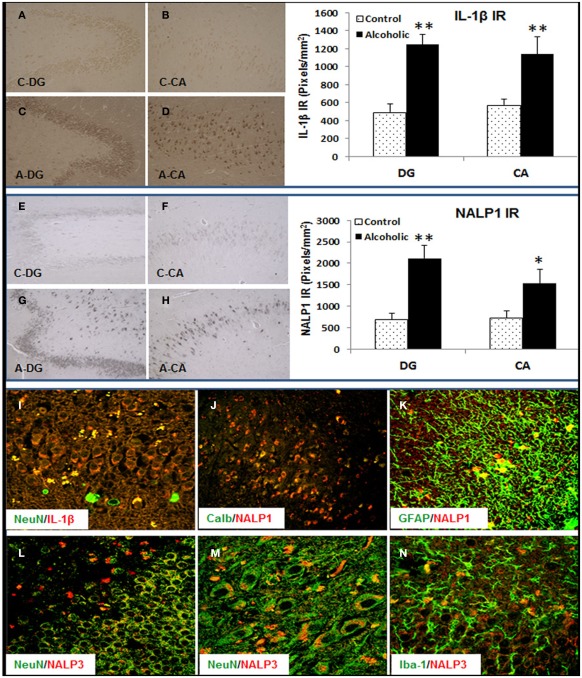
Figure 10.
Increased expression of Inflammasome-IL-1β proteins in alcoholic human brains. Hippocampal sections from 10 controls and 10 alcoholic patients were stained and histochemistry quantitated. Although the cause of death varied among subjects, 9 of 10 controls and 6 of 10 alcoholics died from cardiovascular disease, and none of the subjects died from inflammation. Top panel: bar graph indicates average IL-1β+ IR measured from DG and CA in 10 paired controls and alcoholics. Data represent mean ± SEM. DG: ANOVA F(1,18) = 47.75, p < 0.0001, and Fisher post hoc: **p < 0.001 compared with Controls, n = 10; CA: ANOVA F(1,18) = 7.97, p < 0.011, and Fisher post hoc: **p < 0.001 compared with Controls, n = 10. Representative images of IL-1β+ IR are shown: (A) DG-Control, (B) CA-Control, (C) DG-Alcoholic, and (D) CA-Alcoholic. Middle panel: bar graph indicates average NALP1+ IR measured from DG and CA in 10 paired controls and alcoholics. Data represent mean ± SEM. DG: ANOVA F(1,18) = 18.35, p = 0.0004, and Fisher post hoc: **p < 0.001 compared with Controls, n = 10; CA: ANOVA F(1,18) = 4.7, p = 0.044, and Fisher post hoc: *p < 0.04 compared with Controls, n = 10. Representative images of NALP1+ IR are shown: (E) DG-Control, (F) CA-Control, (G) DG-Alcoholic, and (H) CA-Alcoholic. Bottom panel: confocal images of double fluorescent immunostaining show (I) NeuN (green) and IL-1β (red) from DG in alcoholic (original magnification 80×); (J) Calbindin (Calb, green) and NALP1 (red) from CA region of hippocampus in alcoholic (original magnification 20×); (K) GFAP (green) and NALP1 (red) from hippocampal DG of alcoholic (original magnification 80×); (L–N) NeuN (green) and NALP3 (red) from hippocampal DG (L) and CA (M) of alcoholic [original magnification 80× in (D) and 120× in (E)] and (N) microglial marker Iba-1 (green) and NALP3 (red) from hippocampal DG of alcoholic (original magnification 80×).

