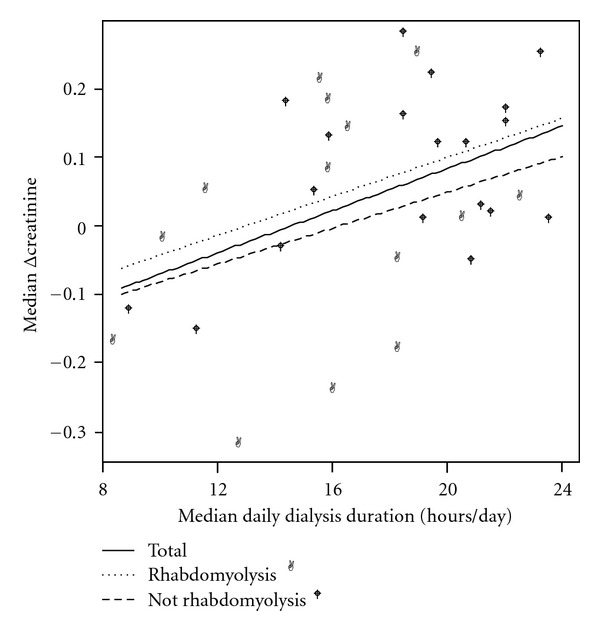
Figure 3.

Scattergram of median daily CRRT duration and median Δcreatinine in the total population and the subgroups with and without rhabdomyolysis. Linear regression analysis showed a significant relationship between median daily CRRT duration and median Δcreatinine in the whole group, r = 0.43, P = 0.012.
