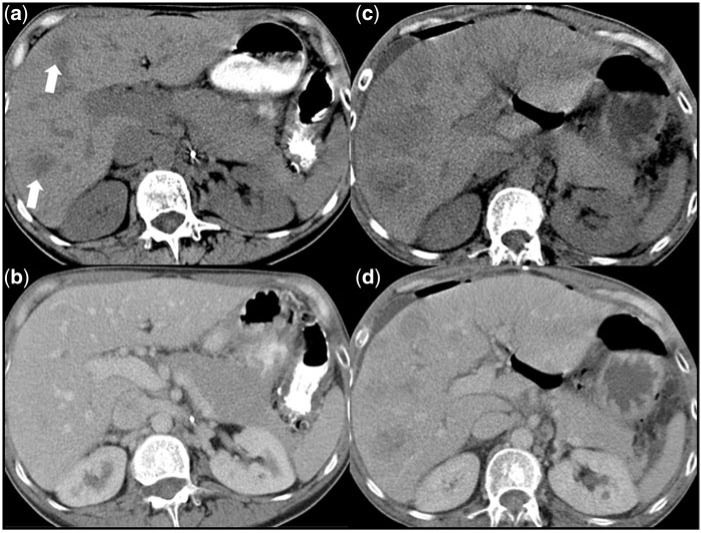
Figure 6.
(a) A non-enhanced CT phase shows 2 hypoattenuated liver lesions (white arrows). (b) These lesions were not detectable on the simultaneously acquired portal venous CT phase. (c, d) At the next follow-up CT scan, both lesions increased and are visible on the non-enhanced and portal venous CT phase.

