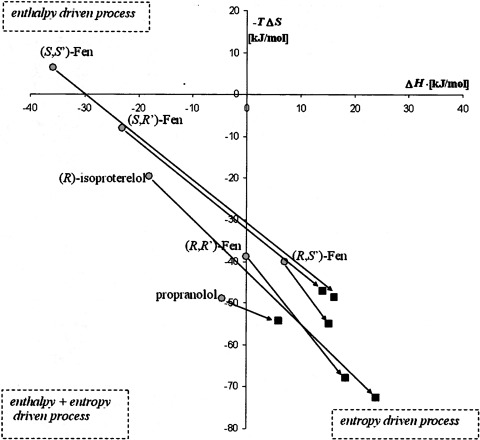
Fig. 5.
Scatter plot of −TΔS° versus ΔH° values for the compounds used in the thermodynamic studies. ○, values previously determined using [3H]CGP-12177 as the marker ligand (Jozwiak et al., 2010b); ■, values determined in this study using [3H]MFen as the marker ligand.

