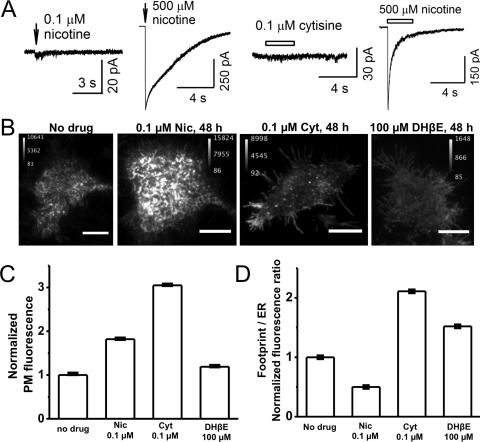
Fig. 6.
The three nicotinic ligands have diverse effects on PM-localized α4β2 nAChRs. A, representative traces showing whole-cell currents induced by puffs of 0.1 and 500 μM nicotine or 0.1 μM cytisine and 500 μM nicotine. B, representative TIRFM images of cells expressing α4-eGFPβ2-wt nAChRs with treatment with the indicated drugs for 48 h. Scale bars, 10 μm. C, bar graph showing normalized PM fluorescence intensity from TIRFM images, normalized as described in Materials and Methods. Drug treatment conditions are shown on the x-axis. Error bars indicate 99% confidence intervals, which show that all differences are highly significant. D, footprint/ER ratios from TIRFM images. Drug treatment conditions are shown on the x-axis. Error bars indicate relative S.E. Data were obtained from 30 to 40 cells imaged for each condition. Nic, nicotine; Cyt, cytisine.

