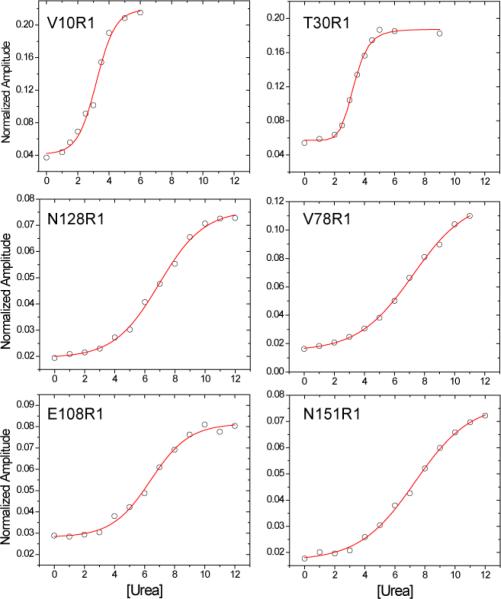
Figure 3.
Plots of the normalized amplitudes of the EPR spectra from five core mutants and one of the barrel mutants as a function of urea concentration. As indicated in Methods, the normalized amplitude is linearly related to the fraction of unfolded protein. The lines represent the best fits to the data using Eq. 3 (see Methods). This fit assumes a two state model where the protein exists either in a folded or unfolded conformation.

