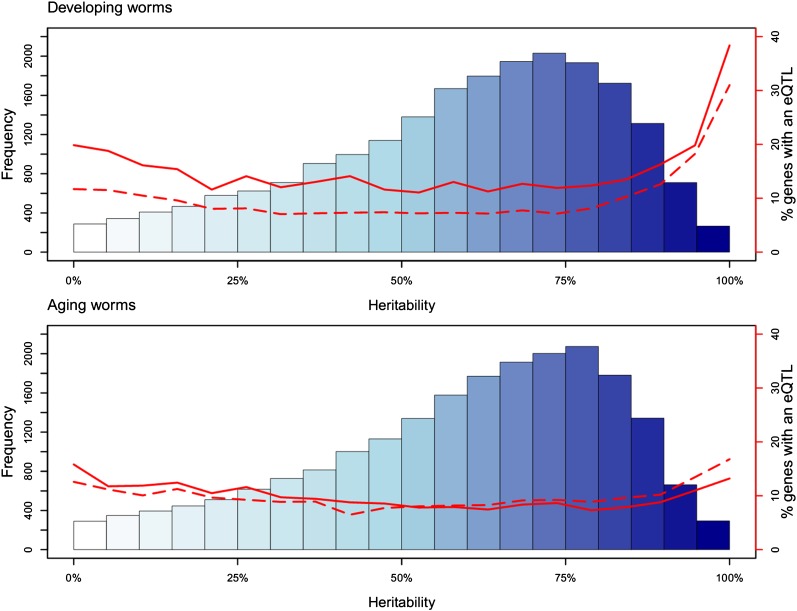
Figure 2.
Heritability and eQTL. Heritability of gene expression in developing and aging worms was plotted. The y-axis (left side) shows the frequency of transcripts within a range of heritability values. The x-axis shows the percentage of heritability per gene. The red line (y-axis, right side) indicates the number of genes with an eQTL (solid line) and number of genes with an a×geQTL (dashed line) within the range of heritability.

