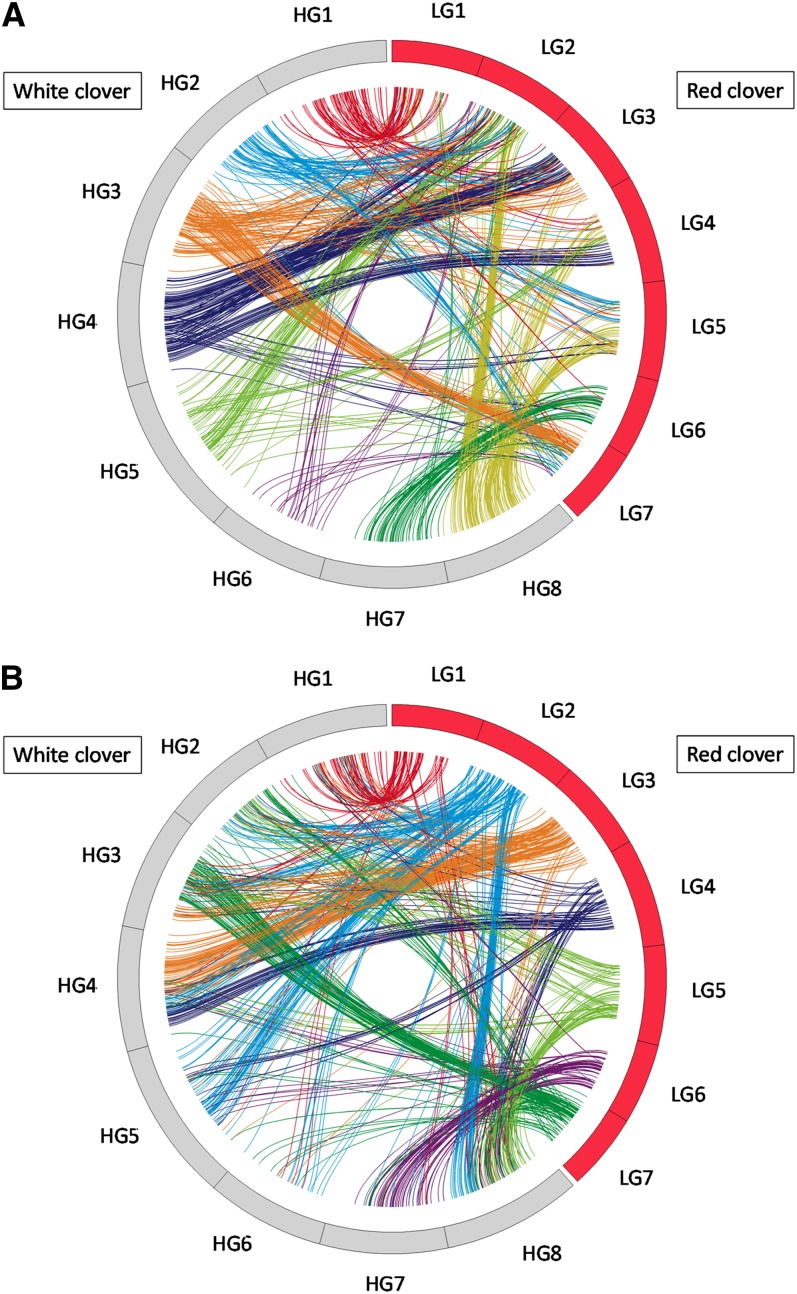
Figure 3.
Graphical view of syntenic blocks between white and red clover. Loci generated common or orthologous markers identified by BLASTX searches with a cutoff E-value ≤ 1e−10. (A) Colors of lines represent white clover homeologous linkage groups of orthologous loci. (B) Colors of lines represent red clover linkage groups of orthologous loci.

