
Figure 3.
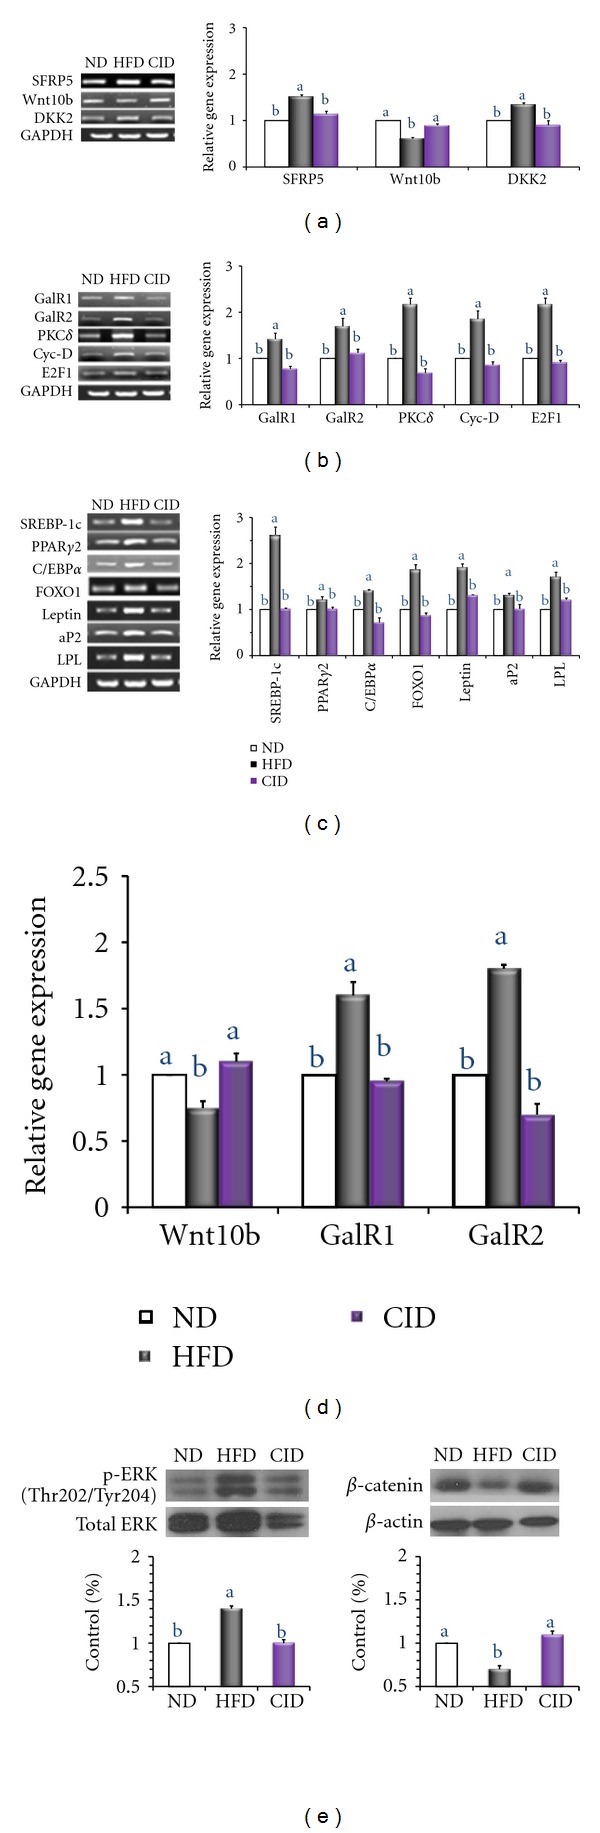
Effect of dietary cinchonine on adipogenic genes. Mice were fed on ND, HFD, or CID. (a) The expression of genes related to adipogenesis was determined by a semiquantitative RT-PCR. (b) Expression of galanin and upstream molecules. (c) Expression of transcription factors and target genes. (d) The expression of Wnt10b, GalR1, and GalR2 was determined by a quantitative real-time RT-PCR. The data shown are the relative density normalized to GAPDH. (e) Protein levels of phosphorylation of ERK (p-ERK), total ERK and total β-catenin in the epididymal adipose tissue of mice by Western blot. p-ERK was normalized to their respective total protein level. Total β-catenin was normalized to total β-actin level. Bars represent the mean ± SEM, n = 8, P < 0.05. Different letters are statistically different.