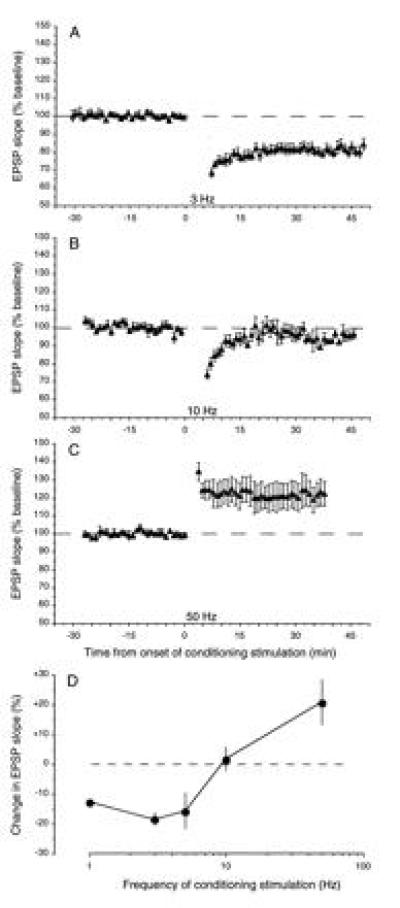
Figure 4.

Effects of conditioning stimulation delivered to the Schaffer collaterals at different frequencies. (A–C) Normalized averages (±SEM) of experiments in which 900 pulses were delivered at different frequencies: A, 3 Hz, n = 5; B, 10 Hz, n = 6; C, 50 Hz, n = 5. (D) The mean (±SEM) effect of 900 pulses of conditioning stimulation delivered at various frequencies on the response measured 30 min postconditioning. For each point, n ≥ 5. Figure modified from ref. 31.
