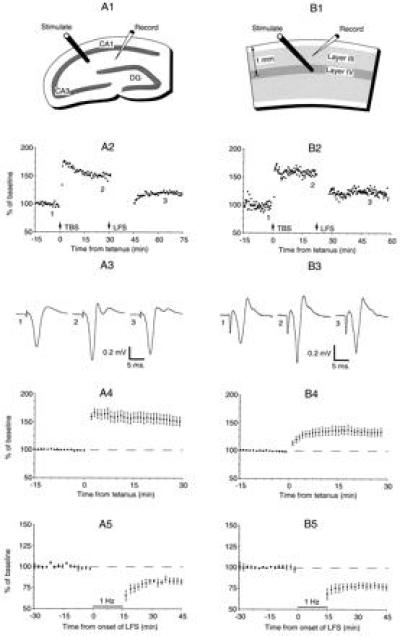
Figure 5.

Common forms of synaptic plasticity in slices of adult rat hippocampus (A) and adult rat visual cortex (B). The top row shows the stimulation-recording configurations. DG, dentate gyrus. The second row shows changes in the extracellular field potential induced by theta-burst stimulation (TBS) and by LFS (900 pulses delivered at 1 Hz in A2 and at 3 Hz in B2). Response magnitude was measured as the change in the initial slope of the negative field potential in A2 and as the peak negativity in B2. The third row shows averages of four consecutive field potentials taken in each preparation before conditioning stimulation, after TBS, and after LFS for the experiments in row 2. The fourth row shows the average change in response magnitude after TBS (n = 4 for A4; n = 19 for B4). The fifth row shows the average change in response after LFS (900 pulses at 1 Hz), starting from an unpotentiated state (n = 5 for A5; n = 5 for B5). Figure modified from ref. 47.
