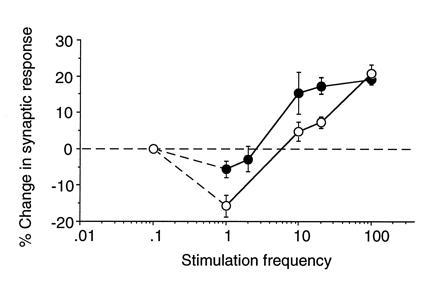
Figure 6.

Evidence for a sliding modification threshold. Frequency-response functions derived from visual cortex of light-deprived (solid symbols) and normal (open symbols) rats. Data points for stimulation frequencies ≥ 10 Hz represent the average change (±SEM) 20 min after the delivery of 120 pulses of conditioning stimulation. Data points for 1 and 2 Hz stimulation represent the average change (±SEM) 30 min after delivery of 900 pulses of conditioning stimulation. The data point for 0.07 Hz is inferred from the fact that baseline stimulation once every 15 sec does not appear to induce synaptic modification in light-deprived or normal cortex. Figure modified from ref. 56.
