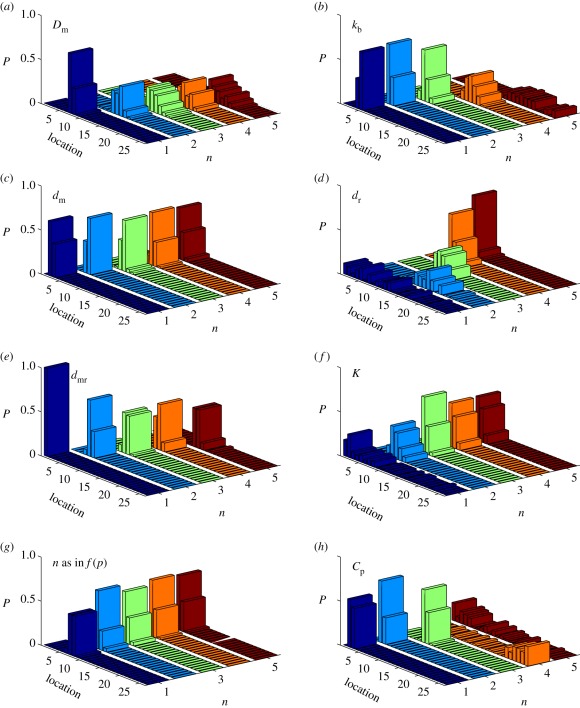
Figure 16.
The distribution of the threshold locations with varying parameters. In (a) 𝒟m = (10n − 9) µm2 s−1; (b) kb = 7.15 ×101−n µM−1 s−1; (c) dm = 6.25 ×10−n s−1; (d), dr = 6.25 ×10−n s−1; (e), dmr = 6.9 ×101−n s−1; (f), K = 4.8 × 101−n μM; (g), n is the Hill coefficient in f(p); and (h), Cp = 1.1 ×10−n µM s−1.

