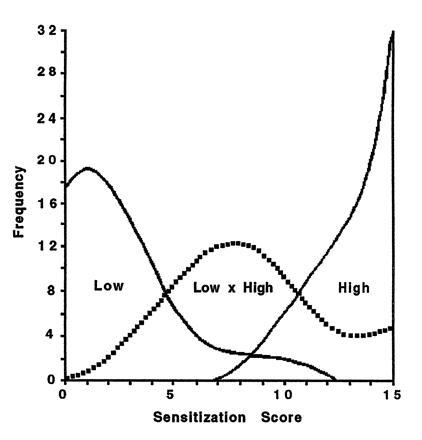
Figure 2.

Frequency distribution of individual sensitization scores from selected high and low strains and F1 hybrid progeny (low × high). In spite of a one-gene mode of inheritance, individual scores for each genotype overlap considerably. (Data from ref. 25.)
