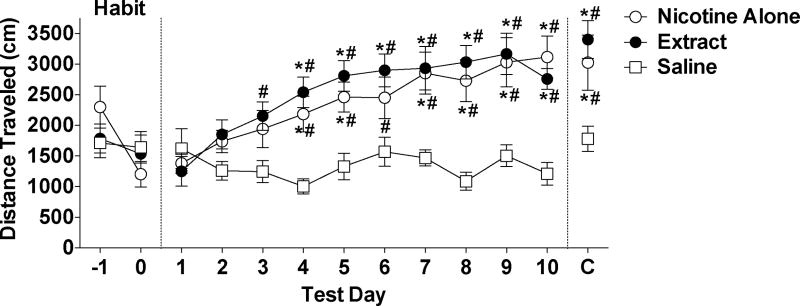
Figure 3.
Total distance traveled (Mean ± SEM) during each 30 min post-test during habituation, sensitization, and challenge phases (see text). * Significantly different from the s.c. saline group (negative control) on that test day, p < 0.05 or 0.01. # Significantly different from test day 1 for that group, p < 0.05 or 0.01.

