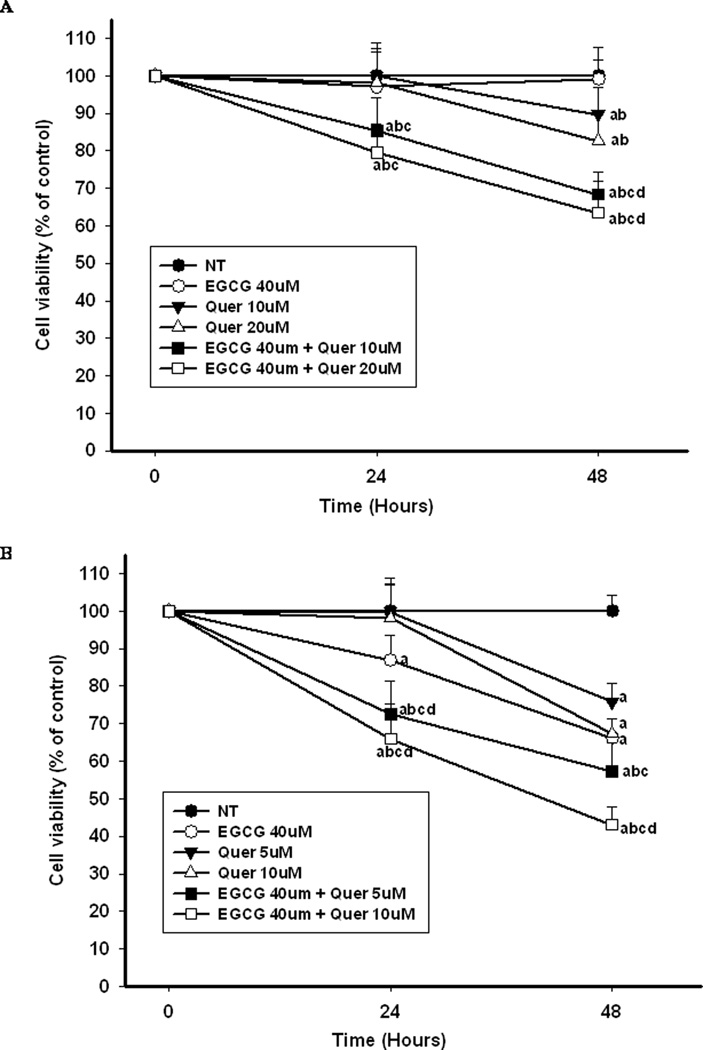
Figure 2.
Cell proliferation under different treatments during 48 hr. PC-3 cells (A) and LNCaP cells (B) were treated with the indicated concentrations of EGCG and quercetin alone or in combination for 24h and 48h. Cell proliferation was measured by ATP assay. The superscript letters represent significant difference between groups (P<0.05): a compared to vehicle control (NT); b compared to 40µM of EGCG treatment; c compared to low dose of quercetin treatment; d compared to high dose of quercetin treatment. Error bars represent standard deviation.

