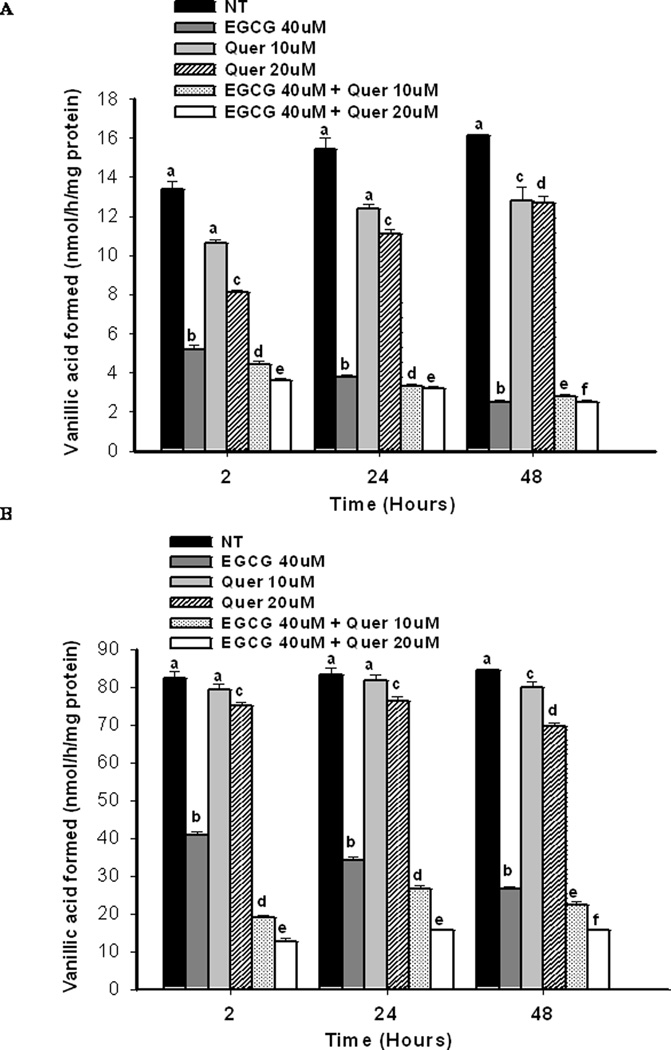
Figure 3.
Impact on COMT activity by different treatments. PC-3 cells (A) and LNCaP cells (B) were treated with the indicated concentrations of EGCG and quercetin alone or in combination for the desired time points. COMT activity was evaluated based on the formation of the methyl metabolite vanillic acid (3-methoxy-4-hydroxybenzoic acid) from dihydroxybenzoic acid (DHBAc) catalyzed by COMT. Groups with different superscript letters at each time point represent significant difference between groups (P<0.05). Error bars represent standard deviation.

