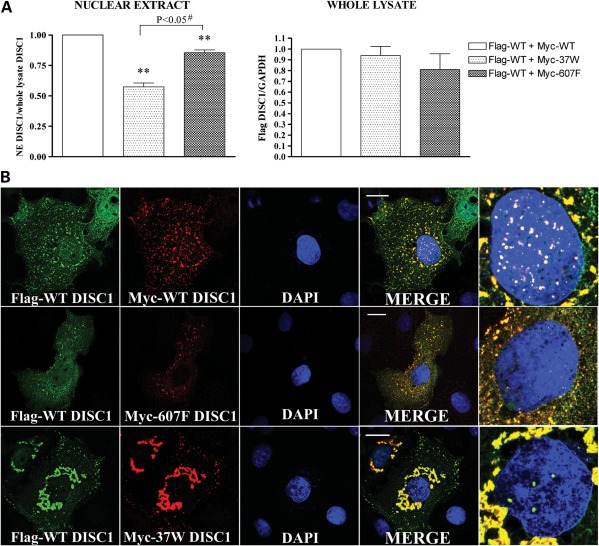
Figure 2.
Dominant-negative effect of 37W and 607F DISC1. (A) SH-SY5Y cells were transfected with Flag-WT DISC1 and an equal amount of either Myc-DISC1-WT, Myc-DISC1-37W or Myc-DISC1-607F. The relative abundance of Flag-WT DISC1 was then quantified by western blotting in whole-cell lysates and nuclear extracts (NE) prepared from the transfected cells. The bars represent the average of three independent experiments. The data are normalized to the relative band density of Flag-DISC1 in samples expressing WT DISC1 only. (B) Sub-cellular distribution of Flag-DISC1 (green) and Myc-DISC1 (red) in representative COS7 cells expressing Flag-WT DISC1 in combination with an equal amount of Myc-DISC1-WT (top), Myc-DISC1-607F (middle) or Myc-DISC1-37W (bottom). Magnifications of the cell nuclei are shown in the far-right panels. **P < 0.01; #two-tailed paired Student's t-test. Scale bars are 20 μm.

