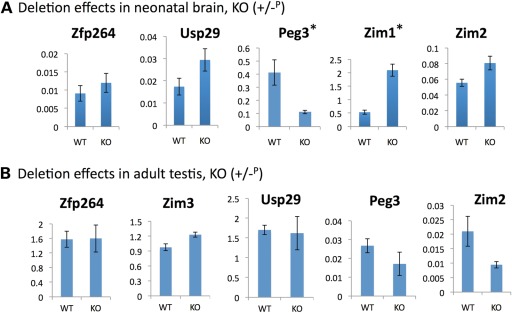
Figure 5.
Deletion effects on the transcriptional levels. (A) qRT–PCR analyses using the total RNA derived from neonatal brains of the normal littermate (WT) and the heterozygous pup with the paternal transmission of the KO allele (KO). All the results are statistically significant except Zfp264. The two stars (*) indicate two genes, Peg3 and Zim1, the expression levels of which were affected the most by the deletion of the Peg3-DMR. (B) qRT–PCR analyses using the total RNA derived from adult testes of the normal littermate (WT) and the heterozygote with the paternal transmission of the KO allele (KO). The expression level of a given gene was measured in triplicates, and the average with standard deviation was shown on graphs. The numbers on Y-axis indicate the relative values against the expression levels of the internal control, β-actin.

