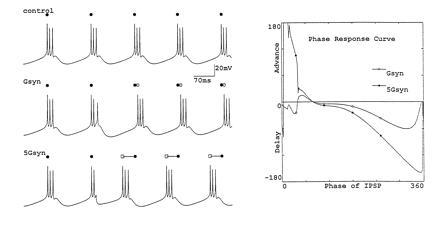
Figure 6.

Effect of changing synaptic strength on the phase—response curve of an oscillator. (Left) Voltage traces of a model oscillator. Top trace shows control; filled circles indicate the first spike in each burst. Middle trace shows an IPSP simulated by a conductance (Gsyn) applied at the end of active phase of the second burst produced a modest phase delay (the time of the unperturbed oscillator is shown by the filled circle, and the first spike of the perturbed burst is shown in the open circle). The bottom trace shows an IPSP that was 5-fold larger (5Gsyn), applied at the same time as that in the middle trace. Note that now the oscillator is phase-advanced rather than phase-delayed. (Right) Full phase–response curve for the effect of the small and large IPSPs (Z.L., unpublished work).
