
Figure 2.
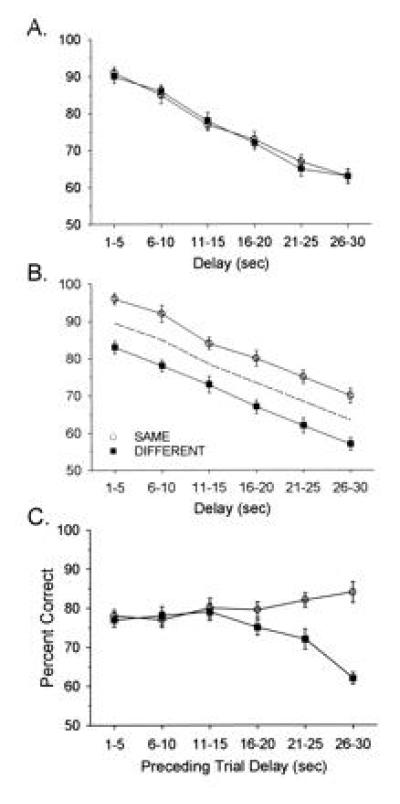
Influence of preceding trial delay and proactive interference. DNMS performance represented in Fig. 1 was analyzed according to the preceding trial type (Same or Different) and the length of the delay interval in the preceding trial. (A) Same plot that in Fig. 1B except only DNMS trials that were preceded by trials with short delays (<15 sec) were included. Each point represents mean (± SEM) DNMS performance from the same seven animals represented in Fig. 1. (B) Same graph as A except for preceding trials with long delays (≥15 sec). Note increase in proactive interference effect Same versus Different. Dashed line represents the mean of both Same and Different curves irrespective of preceding trial type. (C) Same data as in A and B plotted to show separation between Same versus Different pairs of trials as a function of the duration of delay on the previous trial. Each point depicts mean (± SEM) DNMS performance across trial blocks with 1- to 30-sec delays in the current trial (n = 7 animals).