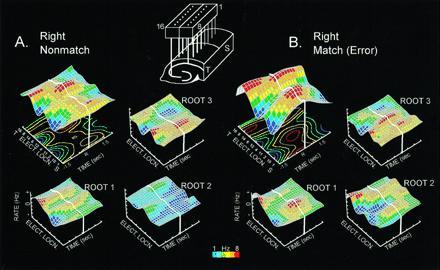
Figure 3.

Illustration of hippocampal ensemble activity in correct and error trials in the DNMS task. (A) Mean ensemble firing pattern for the right nonmatch correct trial type is displayed as a three-dimensional firing surface (larger surface, Upper left) constructed from multiple perievent histograms (100 trials each) for 10 different hippocampal neurons recorded ±1.5 sec before and after a right correct lever press (R and thick white line). All neurons were recorded simultaneously from the electrode array shown at the top of the figure. Display of recording sites from CA1 and CA3 alternate along the electrode location axis (Elect. Locn.) of the three-dimensional surface plot to preserve anatomic relationships. S, Septal location; T, temporal location. Color contour plot beneath the firing surface is a two-dimensional projection of the surface activity. Color bar indicates firing rate (1–8 Hz). The three smaller surface patterns (Lower left and Upper and Lower right) depict the same ensemble firing rates “adjusted” by linear discriminant functions (derived by canonical discriminant analysis) corresponding to task phase (root 1), error trials (root 2) and lever position (root 3), as described (21). Note that activity associated with roots 1 and 3 occupy different regions of the surface, and that root 2 shows very little activity. (B) Mean firing pattern for a right “match” error trial for the same ensemble shown in A. Extracted root firing patterns for the same roots are displayed in the Lower left and Upper and Lower right as in A. Adjusted firing surfaces for task phase (nonmatch) and lever position (right) are similar to correct right lever (roots 1 and 3). Note the increase in activity associated with root 2 which is the source of the difference in overall mean ensemble firing (above) between correct and error trials.
