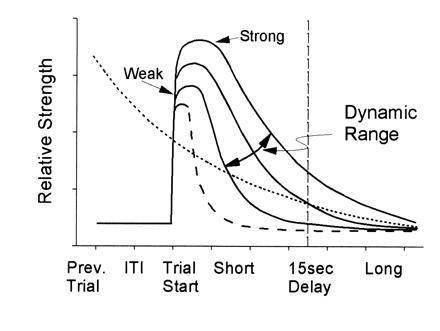
Figure 5.

Schematic illustration of dynamic properties of hippocampal memory. Opposing influences on DNMS performance, strength of hippocampal ensemble encoding (solid lines) and proactive interference (dotted line). The horizontal axis represents the relationship between strength of encoding and DNMS delay intervals. At short delays, encoding can be relatively weak and resistant to interference, but only for a certain delay duration. At long delays, only strong encoding prevents interference across the delay and results in correct performance. The intersection between two curves defines the critical point at which strength of encoding (vertical axis) is able to counter proactive influences (dotted line). Note that the time constant of decay also varies with strength of encoding. The proactive interference curve was purposely plotted with the same relative decay as the strong encoding curve, and represents encoding from the previous trial. The dynamic range (strong to weak) of hippocampal encoding is illustrated by the three solid curves and the oblique arrow. Encoding in the absence of a hippocampus is indicated by the dashed line.
