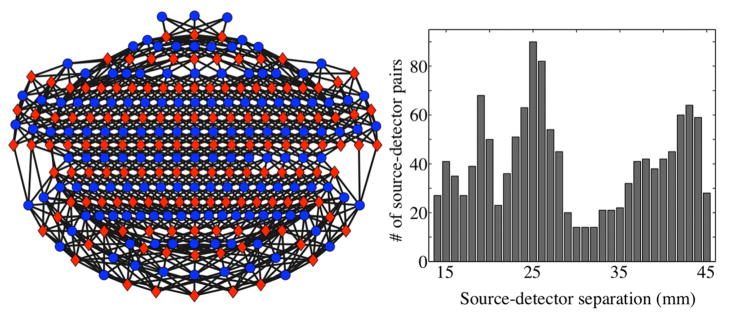
Figure 3.
Source-detector pairs are shown for an example subject (Subject 2) in the schematic on the left. Red diamonds indicate source locations, and blue circles indicate detector locations. The front of the head corresponds to the top of the schematic. Black lines denote the selected source-detector pairs. The diagram is a flat projection of a three-dimensional geometry and therefore the actual source-detector distances are not to scale. A histogram of the corresponding source-detector separations is shown on the right, with the number of source-detector pairs in each bin on the y-axis.

