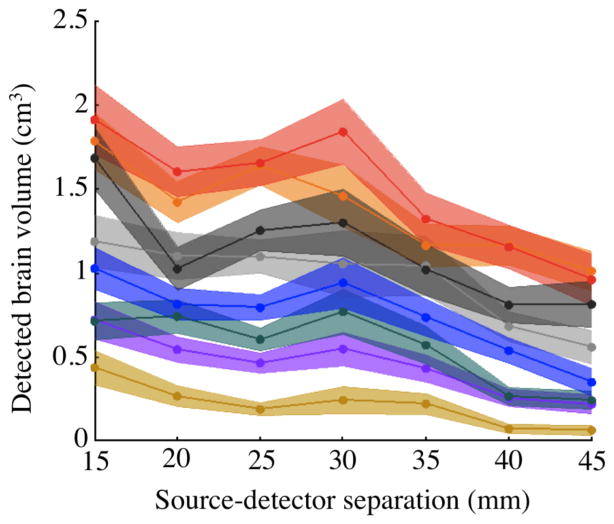
Figure 5.
Mean brain volume detected by individual source-detector pairs above CNR=0 dB threshold vs. source-detector separation. Color indicates subject. All source-detector pairs between 10 mm and 45 mm are included. Source-detector pairs were binned in 5 mm spacing increments and plotted on the x-axis at bin centers. Shaded area shows 95% confidence intervals for each subject.

