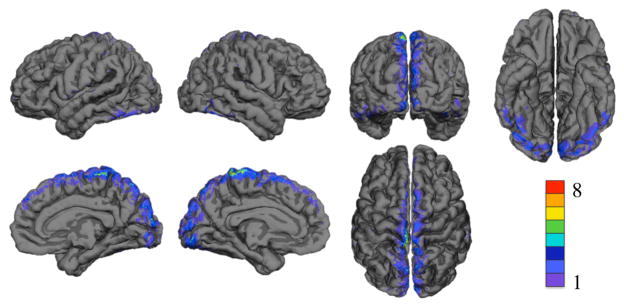
Figure 8.
Decrease in optical sensitivity due to including vasculature displayed on the group averaged surface. Color indicates number of subjects with significant decrease in sensitivity. The top row shows left lateral, right lateral, occipital, and inferior views. The bottom row shows right medial, left medial, and superior views.

