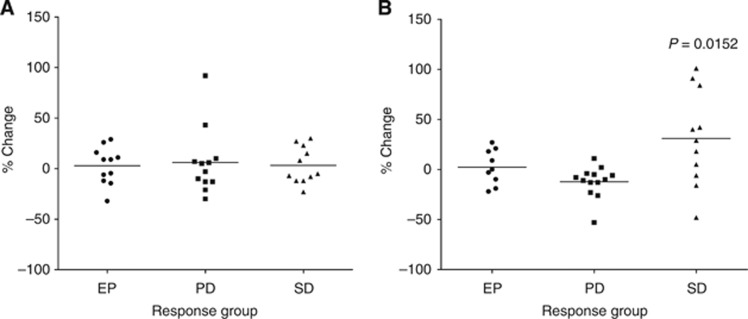
Figure 5.
Percentage change in M65 antigen levels measured after drug treatment stratified into the three main different patient groups identified during the phase I Trial of OXi4503: EP, PD and (SD)/PR. (A) Percentage change from baseline measured at 4/6 h after drug administration and (B) percentage change from baseline measured at 24 h after drug administration. Each point represents an individual patient, and the bar represents the mean value for each group.

