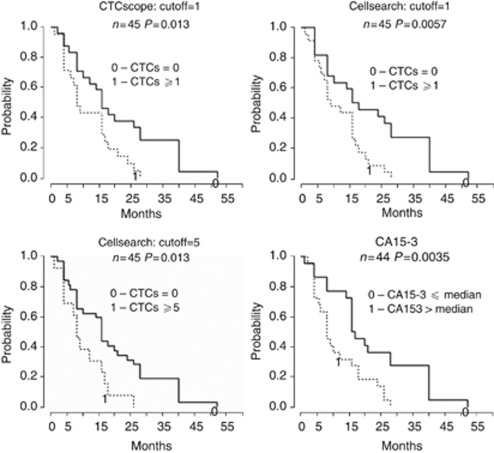
Figure 3.
Kaplan–Meier plots of progression-free survival according to CTC status at time of sampling. Kaplan–Meier survival curves were drawn for patients with positive (dashed line) or negative (solid line) CTC status according to the cutoffs as indicated. For CA15-3, the median was used as the cutoff.

