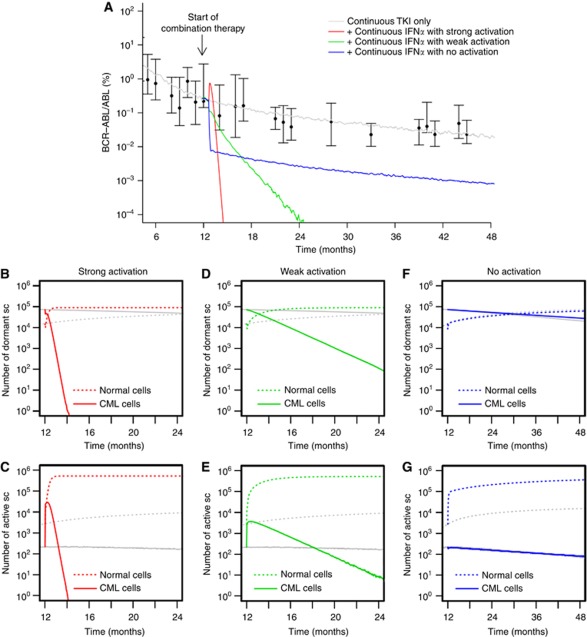
Figure 3.
Continuous TKI plus continuous IFNα. (A) Shown are different response scenarios on the level of BCR–ABL/ABL ratios in peripheral blood: strong activation of leukaemic stem cells similar to normal HSCs (red), weak activation (green) and no activation of leukaemic cells (blue, only normal cells are activated by IFNα). Patient data (black) from the German cohort of the IRIS study (Hochhaus et al, 2009; Roeder et al, 2006) and simulation results for monotherapy with TKI imatinib (grey) are provided for reference. Subfigures (B–G) show corresponding stem cell number in A (quiescent) and Ω (activated), compared with TKI monotherapy (grey) for strong (B, C), weak (D, E), and no activation scenarios (F, G).

