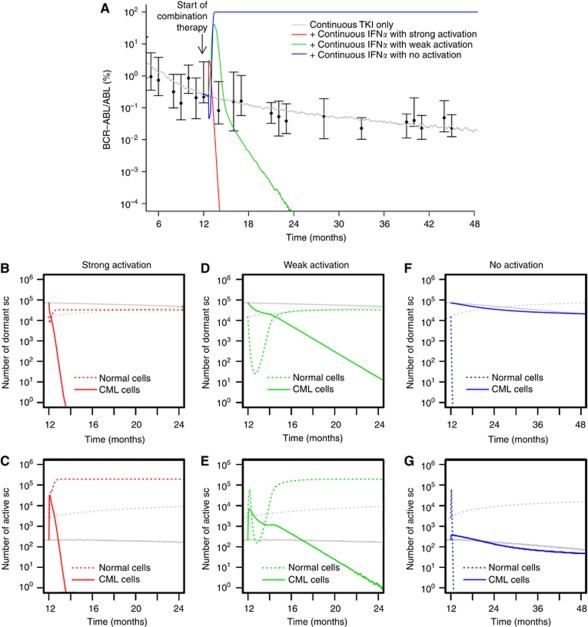
Figure 4.
Continuous TKI plus continuous IFNα with SRD. (A) BCR–ABL/ABL ratios in peripheral blood are shown for strong activation of leukaemic stem cells similar to normal HSCs (red), weak activation (green) and no activation of leukaemic cells (blue). However, in contrast to Figure 3, we assume that IFNα induces an additional SRD among normal and leukaemic cells. Subfigures (B–G) show corresponding stem cell numbers in A (quiescent) and Ω (activated), compared with monotherapy with TKI imatinib (grey) for strong (B, C), weak (D, E), and no activation scenarios (F, G).

