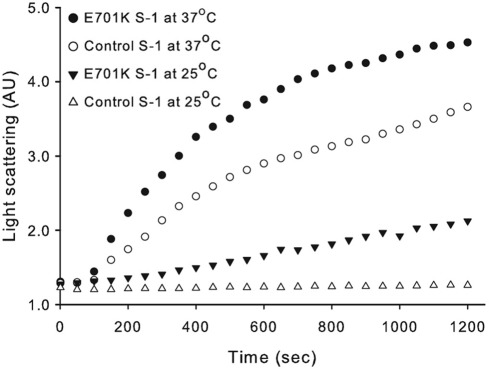
FIGURE 3:
Aggregation kinetics of control (PwMhc2) and IBM-3 (E701K) myosin S-1 fragment as detected by light scattering. The top two curves represent light scattering of S-1 prepared from the IBM-3 mutant (E701K) and PwMhc2 control myosin at 37°C, respectively. Second from bottom and bottom curves represent light scattering of S-1 prepared from the IBM-3 mutant (E701K) and control myosin at 25°C, respectively. These data suggest that the mutant S-1 has a higher propensity to aggregate at both room and elevated temperatures relative to control S-1.

