FIGURE 4:
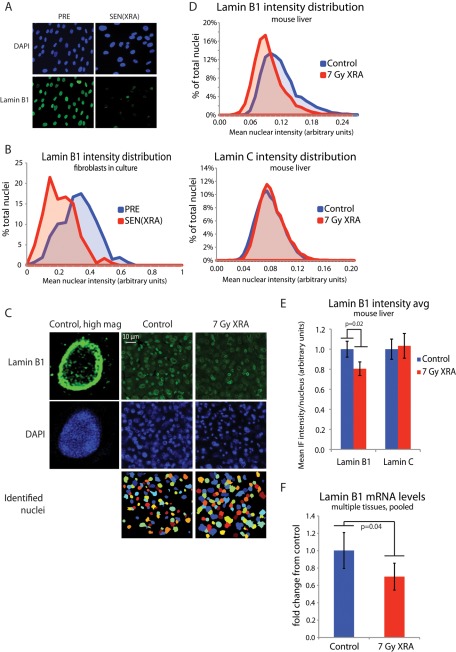
Lamin B1 loss occurs in vivo after acute DNA damage. (A) Representative images of lamin B1 immunofluorescence. HCA2 cells were mock irradiated (PRE) or irradiated (XRA) and allowed to senesce (SEN(XRA)). Cells were fixed and immunostained for lamin B1. (B) Validation of lamin B1 quantitation via immunofluorescence: histogram of nuclear intensity. HCA2 cells were treated as in A. Lamin B1 intensity was measured across each identified nuclear area using Cell Profiler. p < 0.0001 (C) Representative images of lamin B1 staining in mouse liver. Mice were irradiated (7-Gy XRA) or untreated (control). Twelve weeks later, livers were harvested, sectioned, and immunostained for lamin B1. Lamin B1 intensity was measured across each identified nuclear area. (D) Lamin B1 but not lamin C nuclear intensity declines in mouse liver after irradiation: histogram of nuclear lamin intensity. Mice were irradiated or untreated (control). Twelve weeks later, livers were harvested, sectioned, and immunostained for lamin B1 (top) and lamin C (bottom). Nuclear staining was quantitated with Cell Profiler. For both control and XRA conditions, bin populations were calculated by averaging the relative contribution from each of four mice. (E) Lamin B1 but not lamin C nuclear intensity declines in mouse liver after irradiation: average nuclear lamin intensity. Data from D are presented as average of the mean lamin intensity from four mice for both control and XRA conditions. p = 0.02 for lamin B1, p = 0.71 for lamin C. (F) Lamin B1 mRNA declines in vivo after irradiation. Mouse liver, lung, kidney, and skin were harvested from control mice and mice 12 wk after irradiation. mRNA was purified and lamin B1 mRNA levels determined by quantitative PCR, normalized to tubulin. To generate a single lamin B1 mRNA value from four organs for each mouse, each organ was weighted equally (average control lamin B1 level of each organ set to 1) and pooled for each mouse. Whole-mouse pools were then averaged for each condition: control, n = 4; 7-Gy XRA, n = 5.

