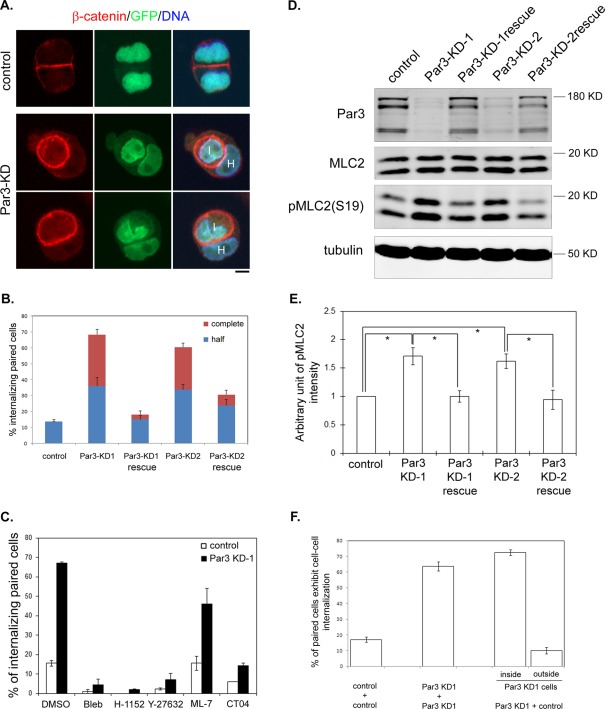
FIGURE 8:
Depletion of Par3 leads to enhanced MLC2 phosphorylation and entosis during cell–cell contact formation. (A) Images of control (top panel) or Par3 KD (bottom panels) lentivirus-transduced MDCK cells. Cells were fixed at 6 h after plating and stained with anti–β-catenin antibody (red). DNA was stained with Hoechst 33342. Virus-transduced cells express GFP. H, host cell; I, internalized cell. Scale bar: 10 μm. (B) Quantitation of cell–cell internalization. Stable cell lines transduced by control lentivirus (control), lentiviruses expressing different Par3 shRNA (Par3-KD1 and Par3-KD2), and corresponding rescue cell lines expressing shRNA-resistant human Par3 were subjected to paired analysis. Cells were fixed at 6 h after plating and analyzed as described in Figure 1E. Data were from three independent experiments. Error bars indicate SD values. (C) Par3 KD-induced cell–cell internalization requires Rho, ROCK, and myosin II activation. Control and Par3 KD cells were treated as described in Figure 5A. Percentages of cell–cell internalization between paired cells at 6 h after plating are presented. Data were from three independent experiments. Error bars indicate SD values. (D) Par3 depletion results in enhanced MLC2 phosphorylation. Control, Par3 KD, and Par3 KD rescue cells were plated at low density on culture dishes. Cell lysates were harvested 6 h later and subjected to Western blotting using anti-Par3, anti-MLC2, anti-pMLC2 (S19), and anti–α-tubulin antibodies. (E) Quantitation of pMLC2 levels from Western blot analysis in (D). Data were from three independent experiments. Error bars indicate SD values. * p < 0.001. (F) Par3 KD cells invade control cells. Control (GFP-negative) and Par3 KD (GFP-positive) cells were mixed and replated on coverglass. Cells were fixed at 6 h after plating and stained with anti–β-catenin antibody and Hoechst 33342. Percentage of internalizing paired ([control/control], [Par3 KD/Par3 KD], and [control/Par3 KD]) cells are shown. Internalizing (control/Par3 KD) pairs were divided into two categories representing Par3 KD cell invading control cell (inside) and vice versa (outside). Data were from three independent experiments. Error bars indicate SD values.

