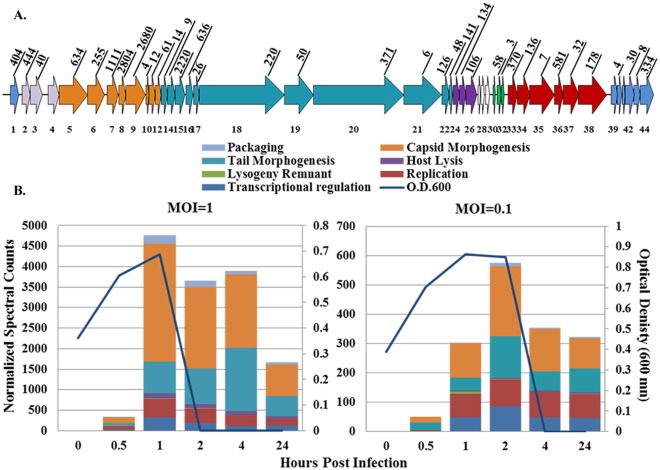
Figure 1. Phage 2972 spectral abundances.
A.) Depiction of phage 2972, color coded according to functional modules. Each arrow represents an open reading frame and numbers on top are normalized spectral counts totaled across all MS runs at MOI = 1. B.) Normalized spectral counts were added together at each time point of infection for MOI = 1 (left panel) and MOI = 0.1 (right panel). Optical density measurements (600 nm) (blue line) show cell lysis occurring immediately following the time points in which the highest numbers of phage spectra are detected at each MOI. Colors within each bar correspond to phage functional modules.

