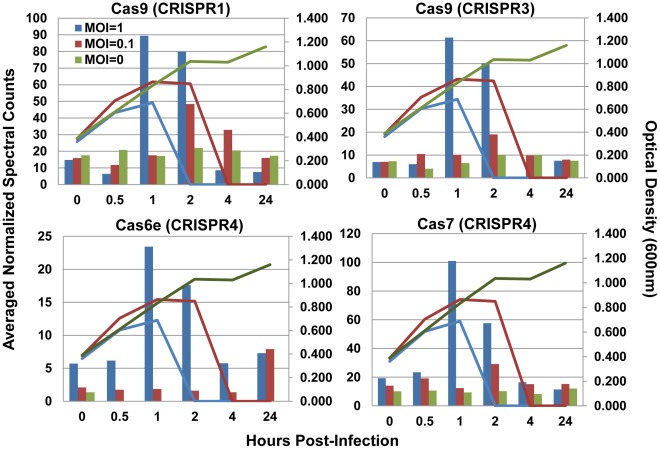
Figure 4. Restriction modification protein subunits increased at peak infection times.
Bars indicate normalized spectral counts averaged between two technical replicates and lines are optical density measurements taken at each time point. Untreated cells MOI = 0, green bars and lines, infected cells at MOI = 0, maroon bars and lines, and infected cells at MOI = 1, blue bars and lines. From top left to bottom right: Type I restriction-modification system methyltransferase subunit (ST89_075300), Restriction endonuclease S subunit (ST89_099800) Restriction-modification enzyme type I S subunit; specificity determinant HsdS (ST89_187033), Restriction-modification enzyme type I M subunit; type IC modification subunit HsdM (ST89_187066).

