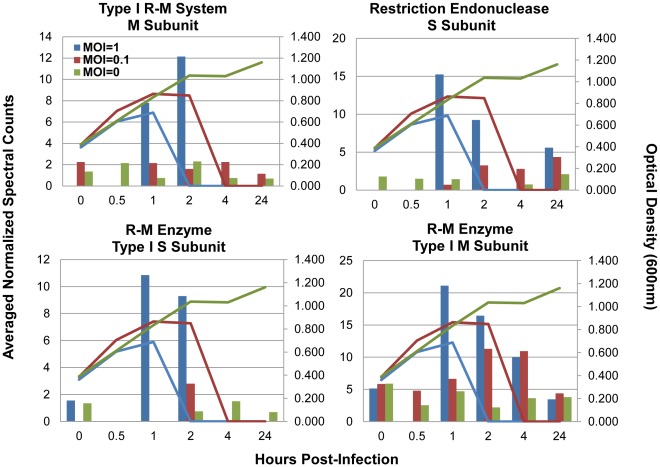
Figure 5. Cas proteins changing in response to phage 2972 infection.
Values are normalized spectral counts averaged between two technical replicates. Untreated cells MOI = 0, green bars, infected cells MOI = 0, maroon bars, and infected cells at MOI = 1, blue bars. Lines of the same color represent optical density measurements for each group. From top left to bottom right: Cas9 (ST89_070900) from CRISPR1 locus, Cas9 (ST89_097000) from CRISPR3 locus, Cas6e (ST89_103830) and Cas7 (ST89_103850) from CRISPR4 locus.

