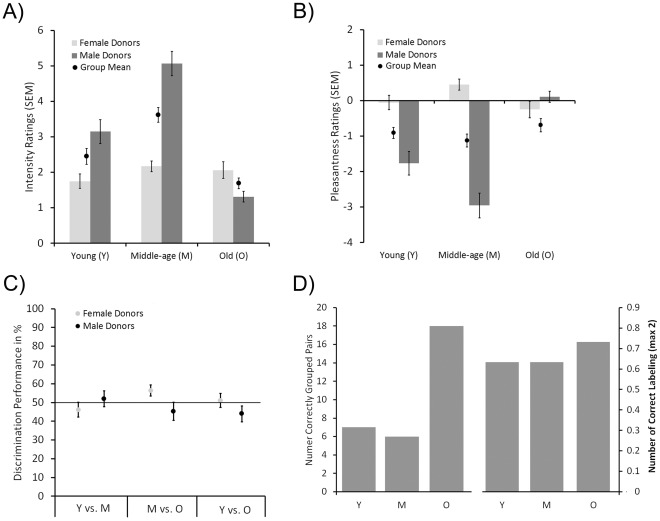
Figure 1. Mean performance for each task.
A) Mean intensity ratings for each body odor category divided by sex of body odor donor. B) Mean pleasantness ratings for each body odor category divided by sex of the body odor donor. Negative values indicate ratings on the unpleasant spectra whereas positive values indicate ratings on the positive spectra. C) Mean discrimination performance, measured in percentage correct responses, according to comparison and donor sex. Solid line in graph represents chance performance (50%). D) Left hand side indicates total correct pairings of each body odor category and right hand side indicates mean correct age labeling of the body odors. In all graphs, error bars denote standard error of the mean (SEM).

