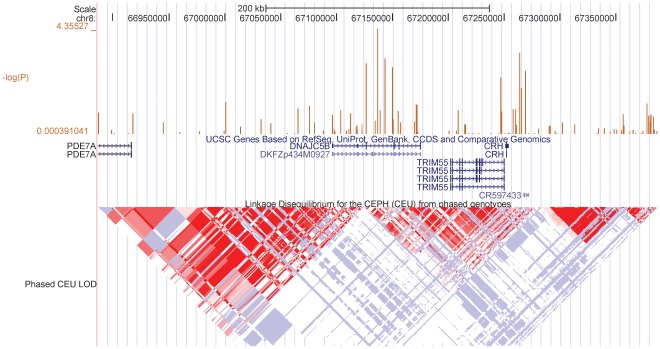
Figure 4. Genomic region of rs13279522.
A ∼500 kb region centered around rs13279522 is from UCSC browser (http://genome.ucsc.edu). Linkage Disequilibrium (LD) information is color-coded at the bottom, genes (horizontal blue lines) and exons (vertical blue lines) are indicated above the LD representation. Vertical orange line correspond to the negative base 10 logarithm of the P value from a case only analysis of CARE and WOSCOPS for SNPs in this region. The location of rs13279522 is indicated by a black arrow.

